                                 2017 ANNUAL CLIMATOLOGICAL SUMMARY

NAME: 3270 Nowell  CITY: West Juneau   STATE: Alaska
ELEV:    97 ft  LAT:  58° 17' 40" N  LONG: 134° 25' 52" W

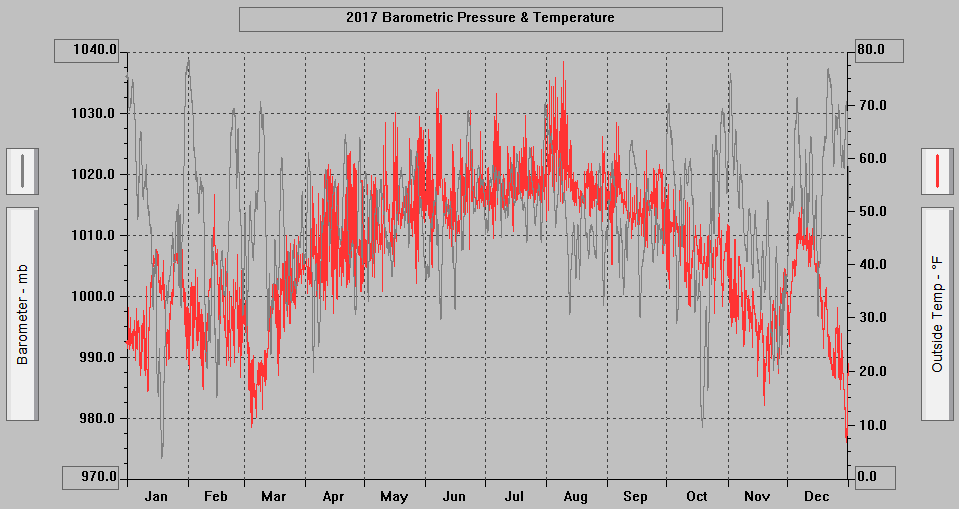
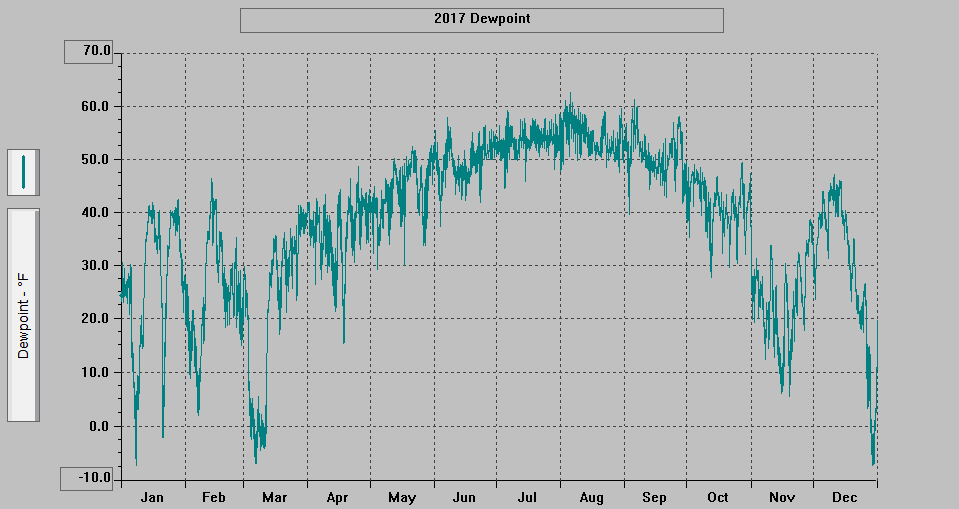
               TEMPERATURE (°F), HEAT BASE 65.0, COOL BASE 65.0
                          DEP.  HEAT  COOL
        MEAN  MEAN        FROM  DEG   DEG                        MAX  MAX  MIN  MIN
 YR MO  MAX   MIN   MEAN  NORM  DAYS  DAYS  HI  DATE  LOW  DATE  >=90 <=32 <=32 <=0
------------------------------------------------------------------------------------
 17  1  35.8  28.5  32.2   0.0  1016     0  45.2  26  16.5   11    0   11   19    0
 17  2  37.7  26.1  31.9   0.0   928     0  53.3  14  16.8    8    0    3   24    0
 17  3  34.0  24.9  29.6   0.0  1095     0  45.6  22   9.7    4    0   12   25    0
 17  4  52.7  36.4  44.5   0.0   614     0  61.5  23  30.9    7    0    0    3    0
 17  5  57.2  43.7  50.4   0.0   453     1  68.7  16  35.1   10    0    0    0    0
 17  6  59.8  48.2  53.3   0.0   352     2  73.0   7  39.6    4    0    0    0    0
 17  7  60.5  51.4  55.5   0.0   296     2  72.2   6  45.1    5    0    0    0    0
 17  8  63.0  51.7  57.1   0.0   266    20  78.3   9  48.2   29    0    0    0    0
 17  9  56.5  47.6  51.7   0.0   398     0  66.8   5  40.2    3    0    0    0    0
 17 10  47.3  38.6  42.9   0.0   684     0  55.2   1  31.1   25    0    0    1    0
 17 11  34.9  26.2  31.0   0.0  1021     0  47.5   1  13.7   19    0   10   24    0
 17 12  36.8  29.6  33.2   0.0   986     0  54.2   8   7.0   30    0   10   16    0
------------------------------------------------------------------------------------
        48.1  37.8  42.8   0.0  8109    25  78.3 AUG   7.0  DEC    0   46  112    0

LOWEST Wind Chill Temp: -1.0 on March 4th @ 2252 (based on 10 minute Average Wind Speed)


                                PRECIPITATION (in)

               DEP.   MAX        DAYS OF RAIN
               FROM   OBS.          OVER
 YR MO  TOTAL  NORM   DAY  DATE .01   .1   1
---------------------------------------------
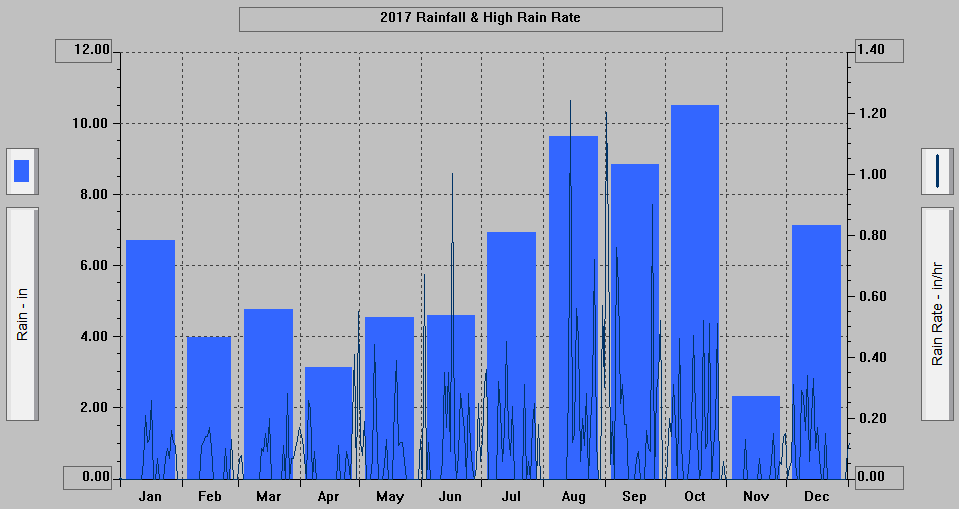
 17  1  6.71   0.15  1.52   16   15   13    2
 17  2  3.99  -0.98  1.13   11    9    7    1
 17  3  4.78+#-0.27  0.99   31   16   14    0
 17  4  3.13  -1.18  0.77   27   14    9    0
 17  5  4.54   0.18  0.71   21   18   14    0
 17  6  4.60   0.81  0.78   16   26   15    0
 17  7  6.93   1.47  0.85    2   21   14    0
 17  8  9.61   2.75  1.32   17   19   16    2
 17  9  8.84  -2.74  0.93    9   21   18    0
 17 10 10.48  -1.05  2.04   27   24   19    2
 17 11  2.33+*-5.97  0.67   29    8    7    0
 17 12  7.13  -0.86  1.32   11   17   15    1
---------------------------------------------
       73.07+ -7.69  2.04  OCT  208  161    8

#Mar. 2: There is much uncertainty as to what the Precipitation was because the blowing and drifting snow
         up until 9 AM prevented capturing most of the snow (whatever amount it was) in the Rain Collector.
*Nov. 21: 1.5" Snowfall only registered .01" which is too low.

HIGHEST Rain Rate: 1.24" per hour on August 14th @ 0340


				Snowfall (in) - Current through 2020 hrs. of day before date shown at top

	       DEP.   MAX
	       FROM   OBS.
 YR MO  TOTAL  NORM   DAY  DATE
---------------------------------------------
 17  1   4.1    --    1.4   23
 17  2   7.4    --    1.9   10 & 25
 17  3  42.6*   --   10.0   13
 17  4  TRCE    --   TRCE    2 & 18
 17  5   0.0    --    --    --
 17  6   0.0    --    --    --
 17  7   0.0    --    --    --
 17  8   0.0    --    --    --
 17  9   0.0    --    --    --
 17 10   0.0    --    --    --
 17 11  20.9    --    6.5   17
 17 12   1.5    --    1.0    2
---------------------------------------------
        76.5*        10.0  MAR

* There is much uncertainty as to what the Snowfall was on March 2 because of the blowing and drifting snow
up until 9 AM.


                                WIND SPEED (mph)

                          DOM   WIND
 YR MO   AVG.  HI   DATE  DIR   RUN (mi)
----------------------------------------
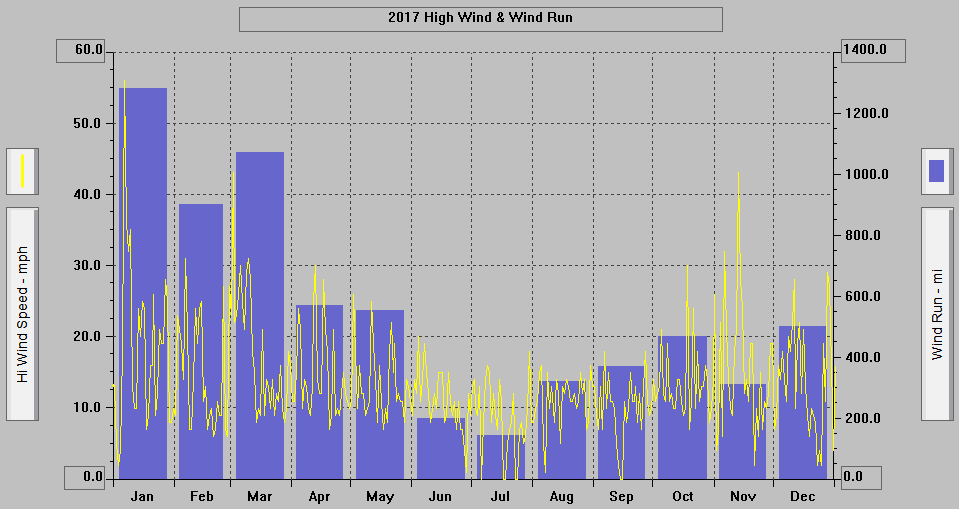
 17  1   1.7  56.0    6   SSE   1,276.96
 17  2   1.3  31.0    6     W     895.62
 17  3   1.4  43.0    2     E   1,096.83
 17  4   0.8  30.0   13     E     543.82
 17  5   0.7  26.0    2    NW     549.82
 17  6   0.3  20.0    4   SSE     196.05
 17  7   0.2  18.0   30   SSE     147.07
 17  8   0.4  16.0    5   SSE     314.38
 17  9   0.5  18.0    6   SSE     368.54
 17 10   0.6  30.0   18   SSE     463.39
 17 11   0.4  43.0   13     E     309.99
 17 12   0.7  29.0   28   SSE*    498.73
----------------------------------------
         0.8  56.0  JAN   SSE   6,661.20

Small Wind Cups in use in 2017
*Wind Vane was frozen on Dec. 19th, and on Dec. 22nd, 23rd, 24th, 25th, 26th, 27th


